

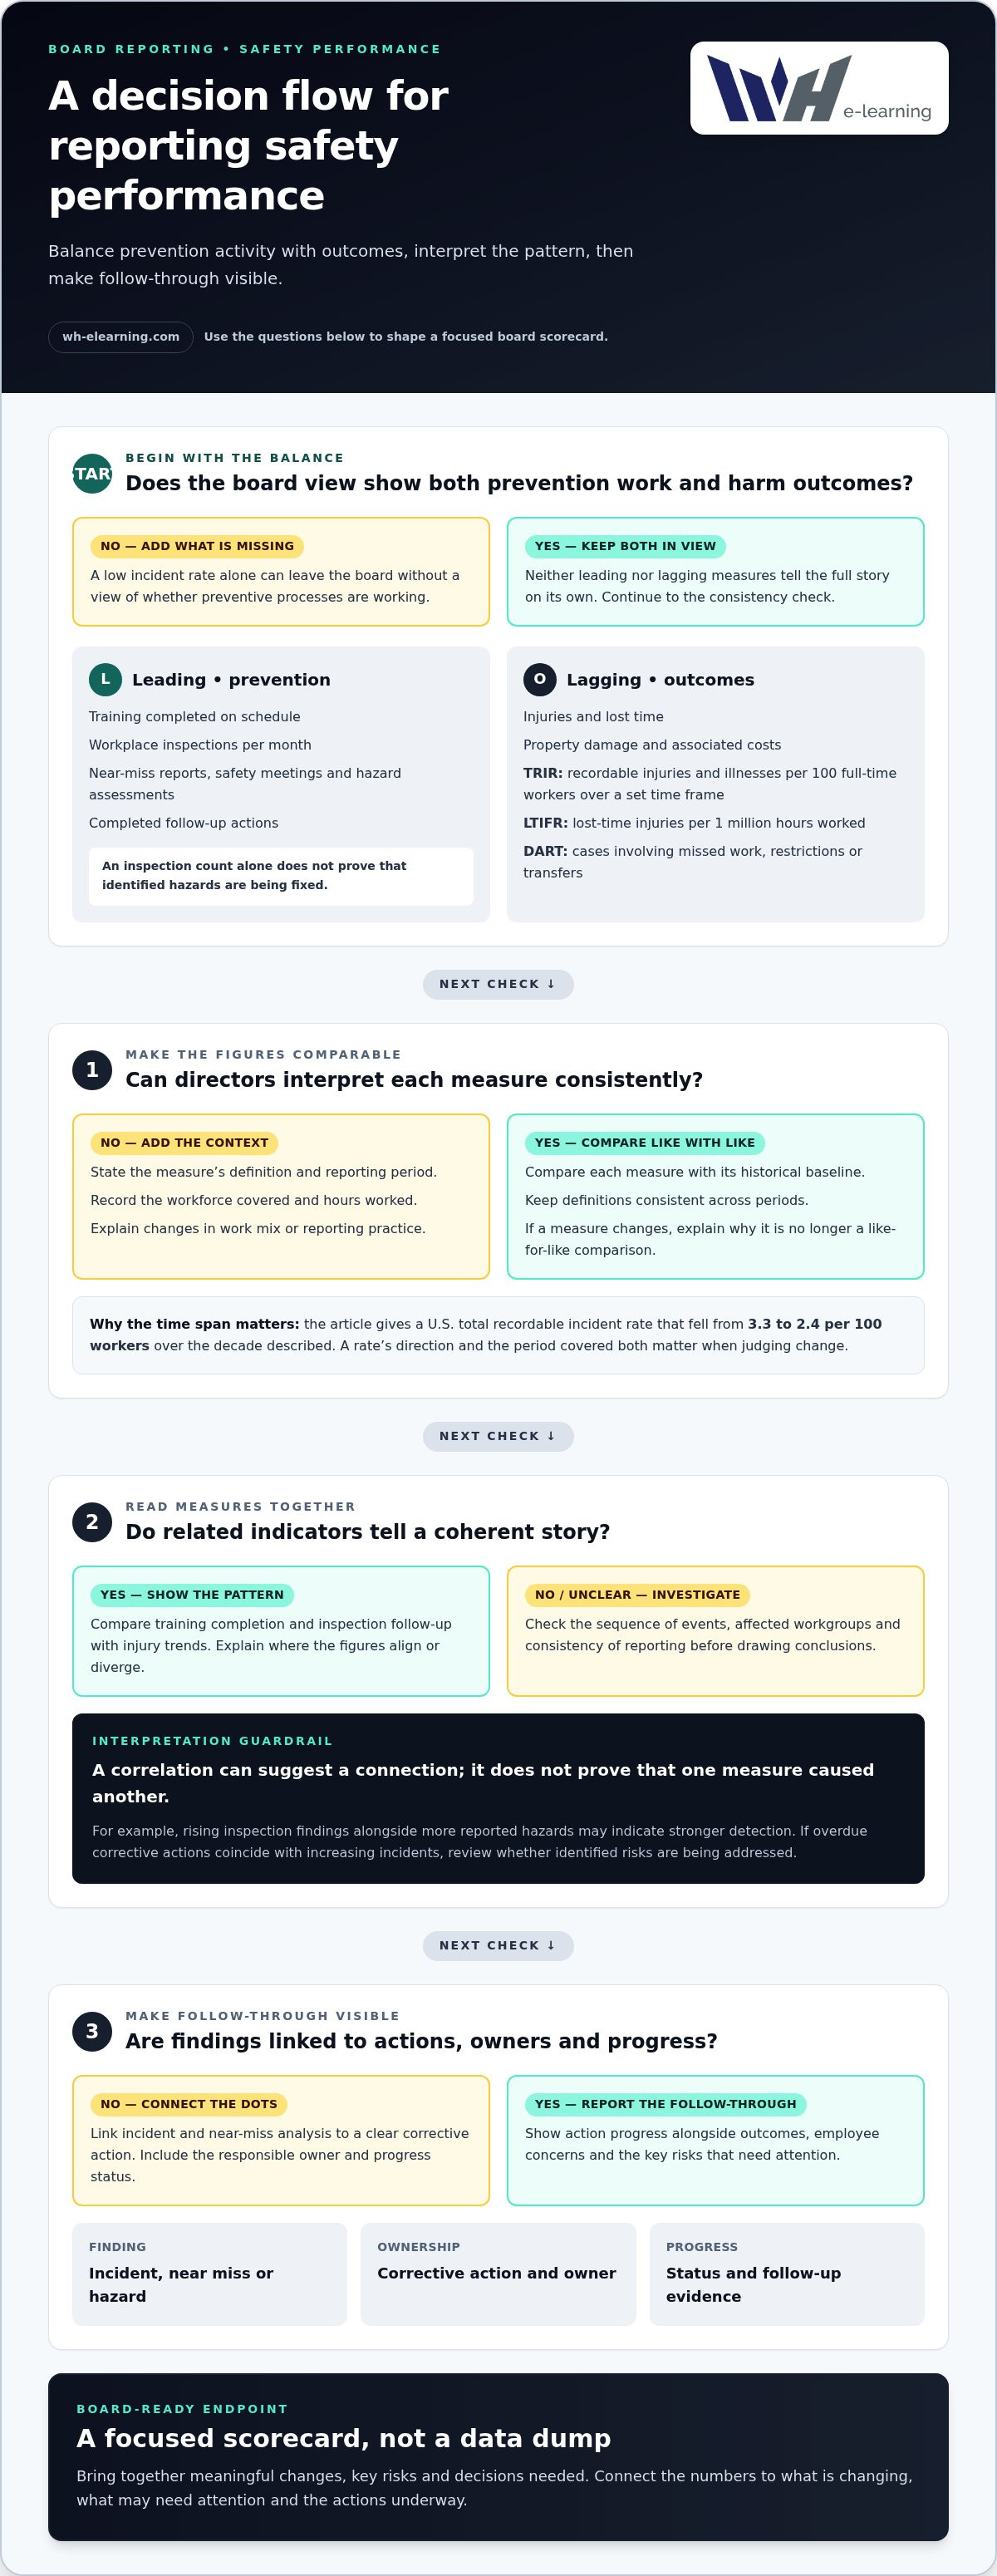
A low incident rate on its own can give a board an incomplete picture. Effective presenting safety performance to the board balances leading indicators, which show whether preventive processes are working, with lagging indicators that record outcomes. Useful measures include safety training completion, workplace inspections, TRIR per 100 full-time workers over a set time frame, and LTIFR per 1 million hours worked.
It’s understandable to focus on injuries and lost time: these outcomes matter. But boards also need to know whether risks are being identified, what is changing and whether corrective actions are progressing. A concise, balanced report connects the numbers to decisions instead of leaving directors with a list of incidents.
This article explains which safety metrics to include, how to interpret trends and correlations, and how to report corrective actions using a focused set of KPIs. You’ll learn how to give the board a clear view of performance, emerging concerns and actions underway.
Key Takeaways
- Balance outcome measures with indicators of whether preventive work is happening, so the board sees both results and emerging risks.
- Compare each metric with its baseline over time and alongside related measures to spot patterns that a single figure could hide.
- Connect incident and near-miss analysis to clear corrective actions, owners and progress updates, making follow-through visible.
- Keep the board’s scorecard focused on meaningful changes, key risks and decisions needed, rather than presenting an unfiltered data dump.
Measuring safety performance: What metrics matter?
A useful safety dashboard pairs prevention measures with records of harm. This gives directors context for injury figures and shows whether everyday controls are working.
Leading safety indicators
Leading indicators measure proactive work and processes that may help prevent incidents before injuries occur. Examples include the percentage of required training completed on schedule and the number of workplace inspections per month. Near-miss reports, safety meetings and hazard assessments can also show whether workers are identifying risks and acting on them. A rising inspection count alone does not prove that hazards are being fixed. Pair activity figures with follow-up evidence, such as completed actions, to show whether prevention efforts are effective. Track indicators consistently so that changes are meaningful.
Lagging indicators and TRIR
Lagging indicators record events or outcomes that have already happened, such as injuries, lost time, property damage and associated costs. TRIR, or Total Recordable Incident Rate, counts recordable injuries and illnesses per 100 full-time workers over a set time frame. LTIFR counts lost time injuries per 1 million hours worked, while DART measures the frequency of cases involving missed work, restrictions or transfers. These metrics help boards understand harm and compare results across periods. Present the measure’s definition and time frame alongside its value, so a change is interpreted consistently rather than mistaken for a change in risk.
Safety performance metrics
Safety performance metrics combine leading measures of prevention with lagging measures of outcomes. Neither group tells the full story alone: low injury numbers can sit alongside overdue training or fewer inspections, while increased near-miss reporting may reflect stronger reporting rather than worsening conditions. Review related indicators together. For example, compare training completion and inspection follow-up with injury trends, then note where the figures align or diverge. OSHA’s Recommended Practices for Safety and Health Programs are built around seven core elements, according to the Occupational Safety and Health Administration. A balanced set helps leaders see what is happening, what may need attention, and where further analysis is useful.
Interpreting trends and correlations between metrics
A single reporting period can hide risks that emerge across several measures. Compare incident rates with inspection findings, reported hazards and operational changes to give directors a clearer view of workplace safety.
Set baselines before judging change
Build a baseline for each metric using historical data, then compare like with like. Record the measure’s definition, reporting period, workforce covered and hours worked, so changes in exposure don’t distort the trend. The U.S. total recordable incident rate fell from 3.3 to 2.4 per 100 workers over the decade described. That example shows why a rate’s direction and time span both matter. A target should reflect the baseline and the specific risk being addressed, rather than an arbitrary figure. Explain any change in work mix or reporting practice alongside the result.
Read correlations as prompts for investigation
Two metrics moving together may suggest a connection, but they do not prove that one caused the other. For example, rising inspection findings alongside more reported hazards may indicate stronger detection. If corrective actions remain overdue as incidents increase, review whether identified risks are being addressed. Check the sequence of events, affected workgroups and consistency of reporting before drawing conclusions. This helps show whether proactive activity may be influencing outcomes or simply recording more activity. Present both the pattern and the next question for management, rather than treating correlation as proof.
Use a consistent framework
ASTM 2920 is a voluntary framework for consistent safety metrics and Serious Incident and Fatality prevention. A shared framework can help teams define measures consistently across sites, making comparisons more meaningful. Keep the same definitions when reviewing trends; if a measure changes, explain the change clearly and avoid presenting it as a like-for-like comparison. Add context from inspections, work processes and safety culture, then make the evidence objectively verifiable. Directors can then distinguish a genuine shift in performance from a change in measurement or reporting.
Safety data analysis, corrective actions, and reporting
Analyse incident and near-miss records together, then link each finding to a corrective action. This helps management report employee concerns, accountability and progress alongside lagging outcomes.
Compliance and safety reporting
Compliance reporting records how workplace practices align with applicable requirements and how identified issues are addressed. Clear records help management demonstrate oversight and track accountability, rather than presenting a compliance claim without evidence. In 2025, penalties can reach $165,514 per willful violation, according to the Occupational Safety and Health Administration. Pair relevant compliance measures with inspection findings, the responsible action owner and progress status. Employee suggestions and reports of unsafe conditions can also reveal hazards that incident records have not captured.
Near-miss reporting adds another useful measure: the Near Miss Frequency Rate counts reported near misses per 100 full-time employees per month. Review changes alongside safety meetings and corrective-action records. For example, a rise in reports with fewer unresolved hazards could indicate that employees are speaking up and teams are following through. Treat the data as a prompt for investigation, not proof of cause. A reporting culture depends on employees seeing their concerns acknowledged and acted upon.
Board reporting on incidents and performance
Board reporting summarises harm, emerging risks and management’s response, giving directors a clear view of performance and accountability. Report incidents, near misses and fatalities alongside their impact, contributing factors, corrective actions, owners and completion status. Explain material changes since the previous report, including changes in reporting volumes or work activity. This makes the measures easier to interpret and helps the board focus on decisions and oversight.
Management should present safety performance to the board monthly or quarterly, using a consistent scorecard and comparing trends. Escalate serious events through the organisation’s established reporting channels, then include the investigation and response in the board update. Keep incident details factual and protect personal information. Distinguish completed actions from those still in progress so directors can see where follow-up is needed.
Presenting concise safety KPIs to boards
A board scorecard should make the safety position clear at a glance. Select measures that connect programme activity with outcomes, then show trends, targets and management responses. The aim isn’t to display every available figure. It’s to help directors determine where oversight or a decision could improve risk control.
Group KPIs around a few key questions: Are controls being applied? Are risks changing? Are corrective actions working? For example, pair training completion with a measure of hazards resolved, then compare both with injury outcomes. This makes the relationship between prevention and results visible without implying that one measure caused another. Label each metric clearly, including its definition and reporting period, so comparisons are like for like.
Give each KPI a consistent status and explanation. A concise entry can show:
- Performance: the current result and direction of travel.
- Context: the target, relevant operational change or notable risk.
- Response: the action owner, progress and next decision required.
For instance, if inspections identify recurring hazards, report whether the related actions are complete or still open. Don’t treat a reduction in lagging indicators as proof that the safety programme is effective without also reviewing leading measures and reporting patterns.
Keep the visual hierarchy simple: show headline outcomes first, followed by a few supporting indicators that explain them. Use the same definitions and format at each board review. If a metric changes because the organisation has changed its method, mark the break in the trend rather than implying a direct comparison. A useful KPI informs a decision, such as implementing a control, assigning resources or reviewing an existing action. Measures that prompt no discussion can remain in operational reporting.
Clear metrics depend on employees understanding the safe practices behind them. Support consistent safety practice by connecting workforce learning with the behaviours your scorecard tracks.
WH eLearning: Health and Safety Training Courses
WH eLearning offers Health and Safety Training Courses for organisations strengthening workforce knowledge behind their safety programme. Its library includes over 100 online courses across health and safety, HR, business compliance and other workplace topics. Video-based, accredited courses can be accessed on any device, with closed captions and machine translation into more than 25 languages.
Use training to support the safe practices your measures track, then review completion and incident patterns together. For teams with different learning needs, WH eLearning offers in-house face-to-face training and course translation into multiple languages. These options can support varied learning needs while keeping board reporting focused on evidence and actions.
Contact WH eLearning to discuss health and safety training courses for your organisation.
Turn board insight into lasting progress
Make each board review a starting point for stronger safety decisions. When directors can see how workforce learning supports organisational priorities, they can connect oversight with practical development. Keep that connection visible as risks, work processes and responsibilities evolve. A considered approach to presenting safety performance to the board makes the discussion useful beyond the meeting, linking insight to the next improvement.
Training can help employees and managers build relevant health and safety knowledge. WH eLearning offers comprehensive online health and safety training courses designed to build essential workplace capabilities. Choose learning that develops the skills your safety programme needs, then consider how those capabilities support wider priorities.
Discuss suitable training options with WH eLearning and take a confident next step towards a more capable, safety-aware workforce.
Frequently Asked Questions
How is safety performance measured?
Measure safety performance by combining outcome data with evidence of how work processes operate. Define each measure, its reporting period and the workforce or activity it covers before comparing results. For example, recordable incident rates require consistent data on workers and hours worked; training measures need a clear definition of required learning. Review data sources and record changes to collection methods to keep comparisons meaningful.
What safety performance metrics should be presented to a board of directors?
Choose metrics that reflect the organisation’s main risks, operational controls and consequences. A board pack might pair injury rates with hazard reports, inspection findings, overdue actions and training completion. Select measures relevant to the work rather than filling the dashboard with every available figure. Briefly explain unusual changes, such as a new work process affecting exposure or a change in reporting practice.
How should board safety dashboards be structured and visualised?
Arrange the dashboard so directors can move from the overall position to areas needing attention. Start with a brief status view, then show a few supporting trends and actions. Use consistent labels, time periods and visual scales; explain what colours mean rather than letting them imply an unexplained judgement. Brief commentary beside a chart can clarify what changed, why it matters and what management will do next.
How can leading and lagging safety indicators be balanced in board reporting?
Pair prevention measures with measures of harm, then interpret them together rather than treating either group as a verdict. For example, rising hazard reports alongside fewer unresolved actions may reflect stronger identification and follow-through. If reported incidents fall while training or inspection activity also declines, the board may need more context. Explain what each pattern suggests and what evidence management will review.
What benchmarks and targets are used to measure workplace safety performance?
Use a historical baseline and consistent definitions as the starting point for targets. Compare results with relevant internal sites or workgroups only where their activities and reporting methods are sufficiently comparable. ASTM 2920 offers a voluntary framework for consistent safety metrics and Serious Incident and Fatality prevention. Set targets around the risks and improvements the organisation is addressing, and explain the rationale to directors.
Which safety performance trends and analysis are most useful for board oversight?
Prioritise trends that connect operational activity, emerging hazards and management follow-through. Examine results by workgroup, site or activity where the data supports a fair comparison. For example, review recurring hazard types alongside action completion and incident patterns to identify where controls may need attention. Flag sudden changes, persistent patterns and reporting gaps, then state the decision or oversight question each finding raises.


